Climate Experience:
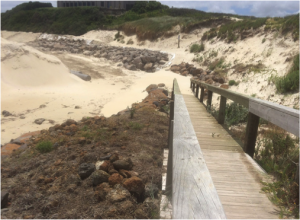
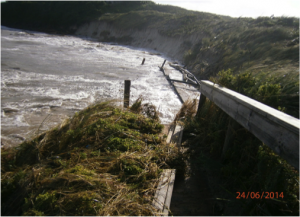
Citizens have noticed Pea Soup beach becoming increasingly under threat by sea water.
Explanation:
- Oceans have been absorbing more than 80% of the extra heated added to the climate system, this causes seawater to expand and rise.[1]
- Melting glaciers and ice sheets also contribute to sea level rise.[2]
- As sea levels rise they can threaten nearby infrastructure.[3]
- Victorian waters are increasing in temperature faster than anywhere else in Australia.[4]
- Southern Australian sea surface temperatures have been above the average for the past 26 consecutive years.[5]
- Sea level is approximately 225mm higher now than in 1880.[6]
Ramifications:
- Current sea level rise is expected to speed up.[7]
- If current human activities continue as normal seas would likely rise by over 2m by 2100.[8]
- 1m sea rise in Victoria will put between 31,000 and 48,000 residential buildings under threat, with a current value between $8-11billion. It will also put up to 3,500km of roads under threat of inundation.[9]
- 82% of Victorians live within 50km of the coastline.[10]
- Frequency of storms are also expected to increase, further impacting vulnerable coast lines.[11][12]
What can be done?
- Email your local MP and tell them that action on climate is important to you and explain the impacts being felt in your area. One email might not feel like much but most politicians consider it to be representative of 100 citizens.
- Get involved with local groups taking action on climate, in this community look out for …..
- Help support the Act on Climate collective by donating; we are leading the charge for climate action. Your donation helps in advancing policies that prevent climate change from getting worse, we aim to empower communities and build a strong pro-climate-action constituency that governments can’t ignore, and as an added bonus it’s tax-deductable.
- Get involved with Act on Climate. We meet every Monday at 6pm (upstairs at 312 Smith St, Collingwood) and welcome all newcomers to join in the fight for climate justice. If you are unable to attend, follow us on Facebook, Twitter, and Instagram to keep up with the latest campaign.
* We aim to keep our material as accurate and as relevant as possible. Working with climate science, a field that is being constantly updated, keeps us on our toes. Information on this site was gathered on June 1 2019; if you notice information that needs updating please let us know. For the full reference list please see the following.
__________________________________
[1]Jonathan Gregory et al., “Climate Change 2007: The Physical Science Basis,” (2007).5.
[2]JA Church et al., “Climate Change 2013: The Physical Science Basis. Contribution of Working Group I to the Fifth Assessment Report of the Intergovernmental Panel on Climate Change,” Sea level change (2013).1142.
[3]Katie K Arkema et al., “Coastal Habitats Shield People and Property from Sea-Level Rise and Storms,” Nature Climate Change3, no. 10 (2013).913.
[4]“Climate change – trends and extremes: trends map,” Bureau of Meteorology, access April 29, 2019, http://www.bom.gov.au/climate/change/#tabs=Tracker&tracker=trend-maps&tQ=map%3Dsst%26area%3Daus%26season%3D0112%26period%3D1980
[5]“Climate change – trends and extremes: time series graph,” Bureau of Meteorology, access April 29, 2019, http://www.bom.gov.au/climate/change/#tabs=Tracker&tracker=timeseries&tQ=graph%3Dsst%26area%3Dsth%26season%3D0112%26ave_yr%3D0
[6]Victoria, “Climate-Ready Victoria: Grampians.”2.
[7]“Australia’s coastal living is at risk from sea level rise, but it’s happened before,” The Conversation, published January 19, 2018, http://theconversation.com/australias-coastal-living-is-at-risk-from-sea-level-rise-but-its-happened-before-87686
[8]Jonathan L Bamber et al., “Ice Sheet Contributions to Future Sea-Level Rise from Structured Expert Judgment,” Proceedings of the National Academy of Sciences (2019).1.
[9]Efficiency, “Fact Sheet – Victoria.”1.
[10]“How many people live in Australia’s coastal areas?,” Australian Bureau of Statistics, published February 27, 2004, http://www.abs.gov.au/Ausstats/abs@.nsf/Previousproducts/1301.0Feature%20Article32004
[11]Climate Council, “Weather Gone Wild: Climate Changed Fuelled Extreme Weather in 2018,” (Sydney2018).4.
[12]Guerreiro et al., “Detection of Continental-Scale Intensification of Hourly Rainfall Extremes.”803.